Prototypes


[{incident: "Larceny Theft", count: 4024}, {incident: "Other Miscellaneous", count: 948}, ...]
If the length of the name of an incident contains is more than 26 characters, leave the first 24 characters and replace the rest with ".."!
[1] Data by SFPD Indicents
[2] Letter Count Bar Chart (d3v4) by Sophie Engle
[3] Zillow Affordability Heatmap by Sophie Engle
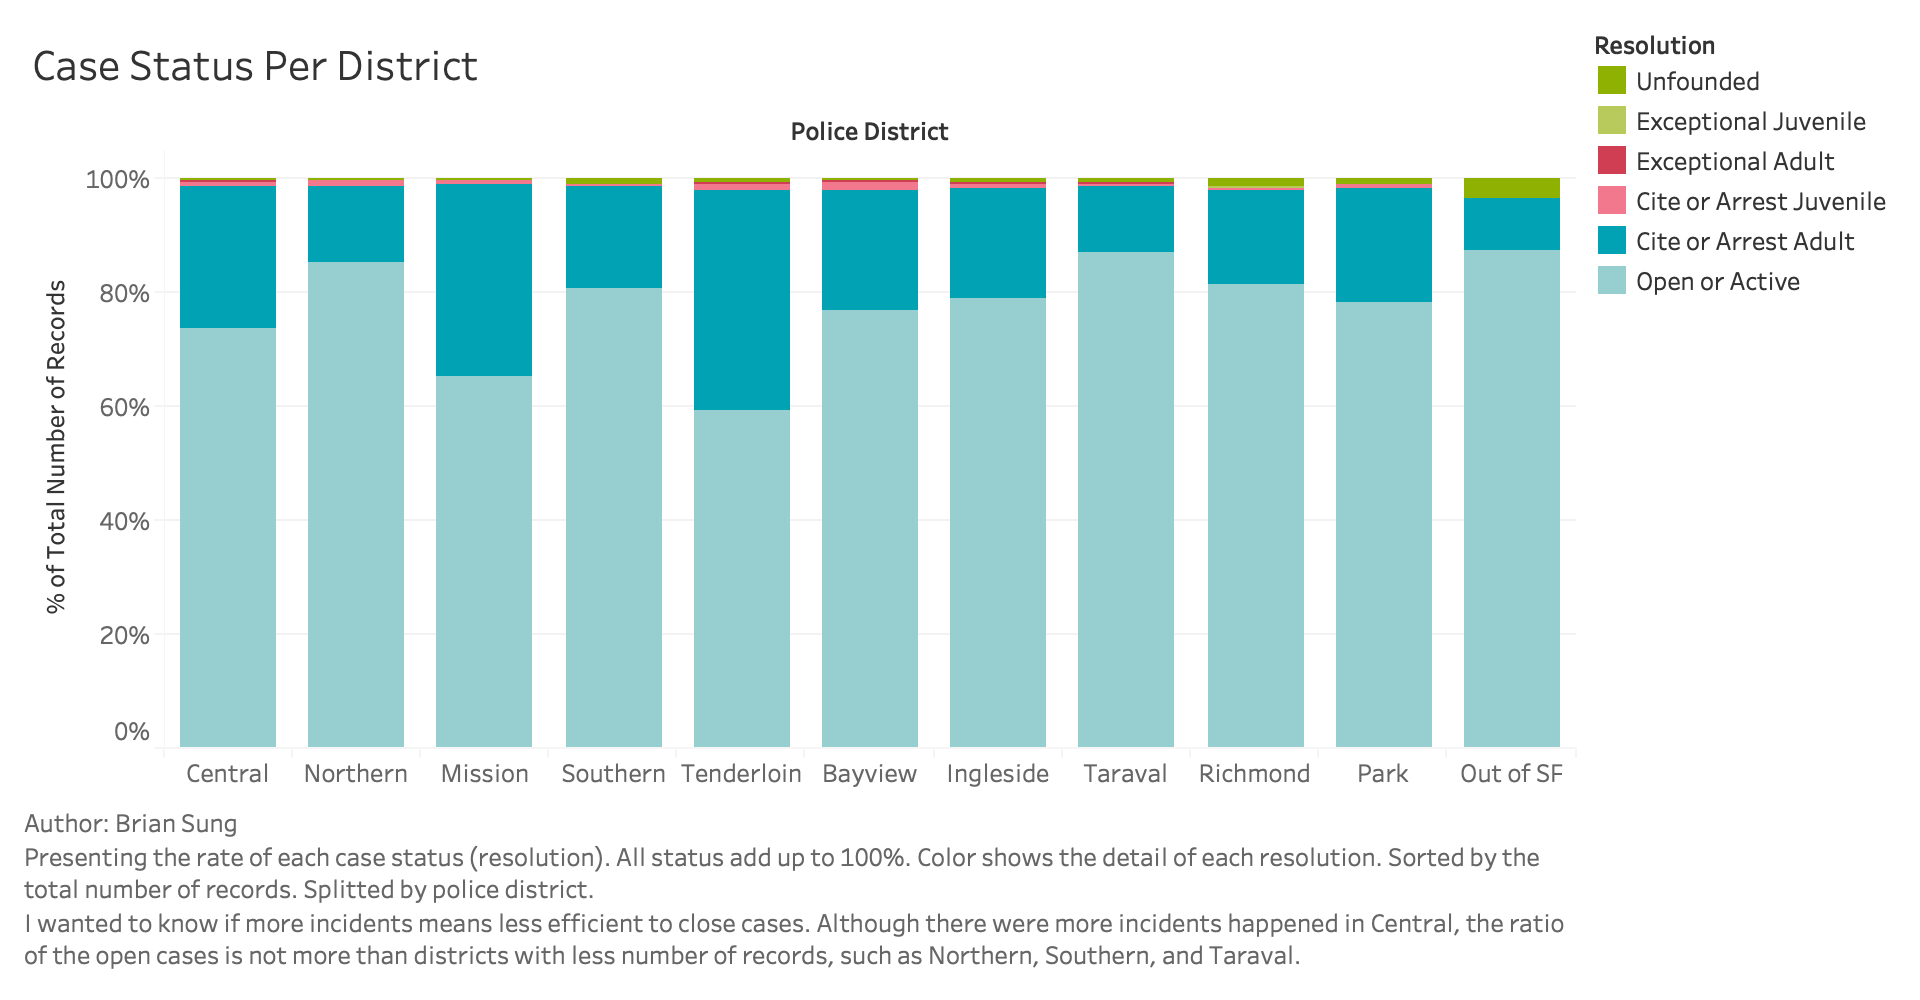
[{district: "Central", total: 2174, values: [{resolution: "Open or Active", percent: 73.82704691812327, start: 26.172953081876727}, ...]}, ...]
[1] Data by SFPD Indicents
[2] Letter Count Bar Chart (d3v4) by Sophie Engle
[3] Zillow Affordability Heatmap by Sophie Engle
[4] Stacked to Normalized Stacked Bar Chart by Tomas Apodaca
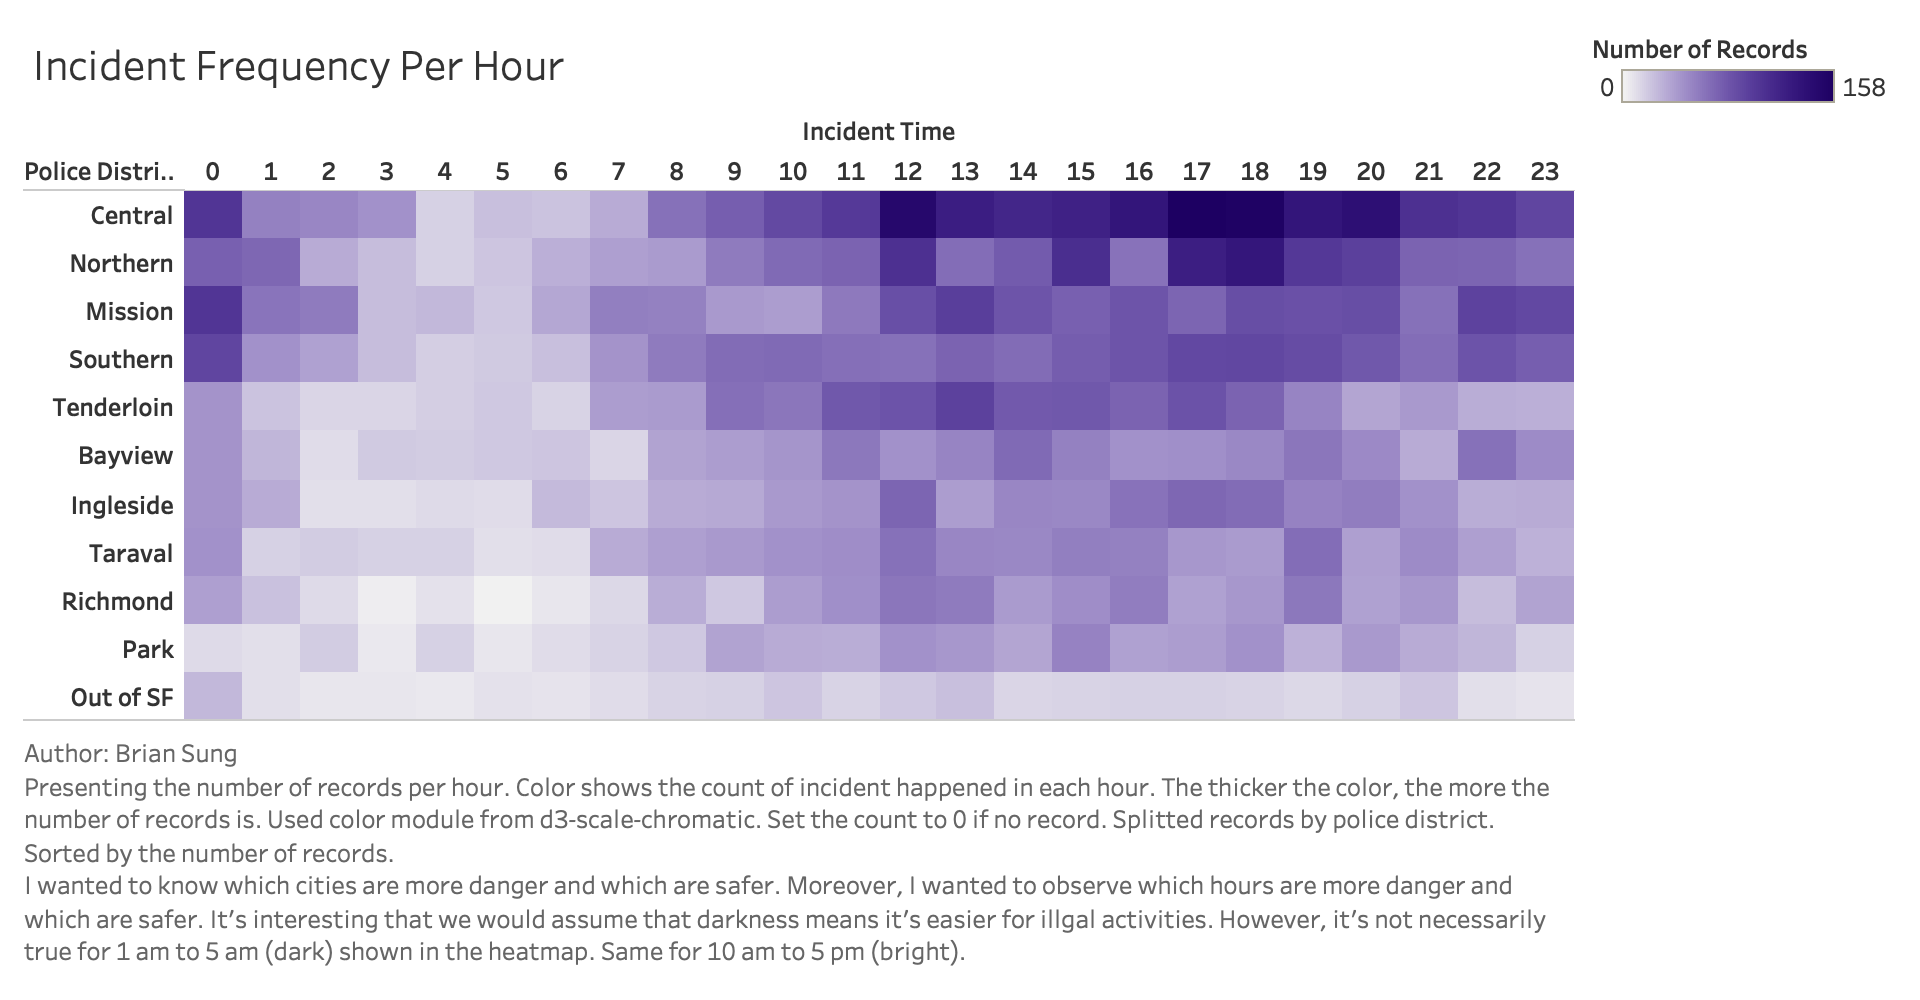
[{district: "Out of SF", total: 292, time: [{hour: 0, value: 25}, {hour: 1, value: 8}, ...]}, ...]
[1] Data by SFPD Indicents
[2] Letter Count Bar Chart (d3v4) by Sophie Engle
[3] Zillow Affordability Heatmap by Sophie Engle
[4] Color by d3-scale-chromatic
| Done? | Letter | Justification |
|---|---|---|
| D | Created five different visualizations with three different encodings in Tableau. In these visualizations, five different perspectives were presented, three of them used color to encode data. Titles, axis labels and captions were provided in static pictures of prototyps. | |
| C | Implemented Incident Distribution in D3. Matched as much of the design from your Tableau prototype as possible. Included the caption and title. | |
| B | Implemented Case Status Per District in D3. Matched as much of the design from your Tableau prototype as possible. Included the caption, title and legend. | |
| A | Implemented Incident Frequency Per Hour in D3. Matched as much of the design from your Tableau prototype as possible. Included the caption, title and legend. |
For Incident Frequency Per Hour, it's hard to generate same sequential color encoding using both Tableau and d3-scale-chromatic in the same time but I've tried to make it as similar as I can. The two datasets are equal though.
The last two prototypes are for practicing, no D3 implementation now.
